Become a Google Analytics Power User — Part 2: High-Value Traffic
John Garland Digital Direct Marketing, Marketing Analytics, Response MarketingEditor’s Note: This is the second installment of a three-part series that explores how to master Google Analytics for better digital marketing campaigns.
- Become a Google Analytics Power User — Part 1: Understanding Users
- Become a Google Analytics Power User — Part 2: High-Value Traffic
- Become a Google Analytics Power User — Part 3: Improving Site Engagement
Get more power over your site traffic.
In part two of this 3-part series, we’ll be discussing high-value traffic — which is key when it comes to lead qualification, conversion rates, and return on investment (ROI).
Regardless of the product or service you are marketing — B2B or B2C in any industry or category — driving traffic to a site can be easy! But getting the right traffic — consumers (users) who convert into sales — is where it often gets tricky. We’ll explore some practical, hands-on ways to evaluate traffic data while keeping it clean and organized, as well as touch on how to leverage email marketing data (the epitome of high-value traffic). These three areas can help you uncover insights into driving high-value traffic to your site.
Evaluating Traffic Sources: helps with smarter budget allocation
We’ll want to start by looking at traffic by source, which you’ll find in the navigation within Acquisition > All Traffic > Source/Medium. Assuming you are tracking conversions and/or sales, sort the data by your chosen conversion rate in descending order (highest to lowest). Take note of the sources driving the highest conversion rates. These may immediately tell you where to put more marketing dollars.
On the flip side, if you sort by ascending order (lowest to highest), you are likely to see sources that are not converting well, which may help you see where adjustments should be made. Keep in mind that some channels may have value assisting others, beyond driving direct conversions (like Display and Video). Before you decide on pulling out from a channel altogether, it’s important to remember that the default attribution model for Google Analytics is “Last Non-direct Click,” which means 100% of the conversion value gets attributed to the last channel a user came from prior to converting (while ignoring direct traffic).
As an example, your Display or Video campaigns, while doing their own job well, probably don’t drive a lot of Last Click conversions, so you’ll definitely want to dive deeper into the data before making any rash decisions (Hint: look within Conversions > Multi-Channel Funnels > Assisted Conversions).
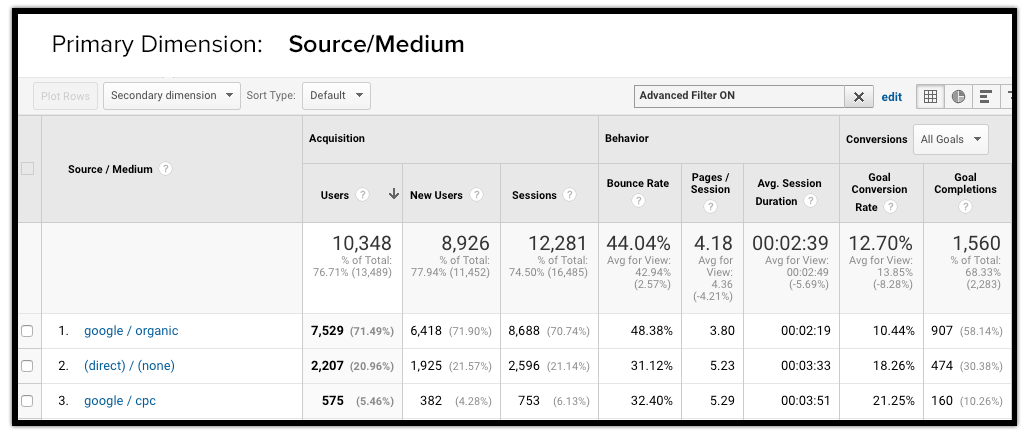
You’ll probably see a number of sources that have high conversion rates, or maybe none, but that they also register low user counts. Try filtering sources that have driven 500 or more users to gain a bit more statistical significance. You may need to adjust your timeframe if you don’t get a lot of daily traffic. Then select each goal and take note of the top sources for each. This filtered dataset can help you decide which sources are candidates to model for tailoring copy or promotions.
You’ll also want to look at other behavior metrics like Pages / Session, Session Duration, and Bounce Rate. These are good indicators of user engagement which typically go hand-in-hand with conversion rates.
Again, the All Traffic report gives you a high-level overview of performance by traffic source, but it can be a great starting point for helping you decide where your marketing dollars may be best spent. Next, we’re going to look at channel groupings.
Reviewing Channel Groupings: helps generate actionable insight
Traffic by channel is found within Acquisition > All Traffic > Channels. These channels are system generated, but there may be times when you want certain data bucketed into a different channel. Sometimes data can get categorized in the wrong channel, too. Luckily, you can see if this is happening and you can create new channels or reorder channels to shift data into the right buckets. Having accurate channels is essential to help you drive actionable insights.
Start by looking at the channel named “Other.” Do you see any sources that you think should be categorized into another channel, or prompts you to create a new channel? Here’s an example: one of our clients had Direct Mail, DRTV, and even some Email sources bucketed under “Other.” While we can report on these sources by other means, such as campaign name and content, they should ideally be grouped into channels other than “Other.”
To fix this, go to Admin > View > Channel Settings > Channel Grouping. Click on the default channel grouping and you’ll see all of the channels broken out and numbered. For the examples mentioned above, I created two new groupings, one for Direct Mail and one for DRTV. The rules were defined using Regex matching for source and/or medium that would match each channel (e.g., “DRTV, TV, or DRV”; “Direct Mail, DM, or touch#X”). For the email campaigns that weren’t bucketed under the Email channel, I simply added those source names to the definition rules.
An example of when you may want to reorder channel groupings is if you had created a new grouping, say for specific referral URLs, under a broader referral group, but you see that new grouping was constantly empty. When that happens, you want to move your new grouping above the general referral grouping, which will process before referral data does.
On a final note, ensuring that your campaign parameters are set up correctly and follow predetermined patterns will help keep your channel groupings accurate.
Optimizing Email Marketing: helps drive high-value traffic
I’m going to briefly discuss email marketing, as refining this channel is imperative to help you drive high-value traffic that yields the highest possible sales and revenue. One thing that many people are uncertain about is when to send emails. If you’ve already sent some emails out using recommended days/times as promoted by MailChimp or the like, that’s perfectly fine and a great place to start.
But once you have data from prior campaigns, it’s important to test different times of the day and days of the week. User engagement data can help inform you about which days/times to test.
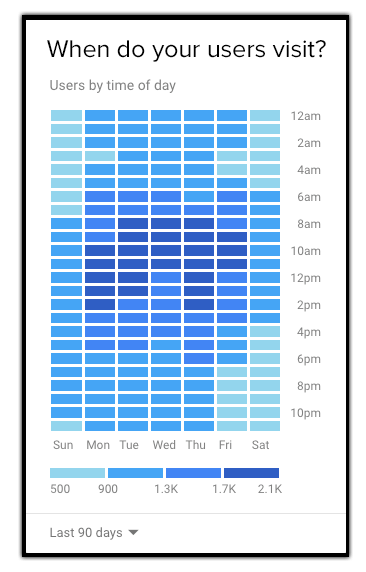
One way to quickly see user engagement by time of day is by simply looking at the “Users by Time of Day” card, located on the “Home” dashboard. Compare the past 30-60-90 days or longer. You’ll likely see similar dark color patterns across certain days of the week and times of the day (see the accompanying illustration) indicating strong user activity. It’s a good idea to test sending emails out at or during these peak times when users are more actively engaged with your site.
If you have a specific list you’re sending to and it’s driving traffic to a specific category, product, or landing page, it’s often better to look at that particular segment’s engagement data instead of the whole site. To do this, you’ll want to create a custom report using a Flat Table, with the dimensions “Day of Week Name” and “Hour.” Add in important engagement metrics such as Number of Sessions per User, Goal Conversion Rate, Bounce Rate, Transactions, and Transactions per User (the latter two if you run an ecommerce store). To focus only on a specific category/product/landing page, you’ll want to create a custom segment that includes a condition to filter Sessions that include only certain URLs.
Now that you have this segmented data, consider a possible test sending emails the day prior to peak conversion days, or even the day after peak volume days in an effort to reengage users, instead of sending during times of high activity.
Subscribe to the DMW Blog so you don’t miss the final chapter of this 3-part series on becoming a Google Analytics power user. And if you’re considering a digital marketing campaign, DMW is always ready to help you strategize, plan, execute, and optimize. Call or email us today.