Become a Google Analytics Power User — Part 1: Understanding Users
John Garland Digital Direct Marketing, Marketing Analytics, Response MarketingEditor’s Note: This is the first installment of a three-part series that explores how to master Google Analytics for better digital marketing campaigns.
- Become a Google Analytics Power User — Part 1: Understanding Users
- Become a Google Analytics Power User — Part 2: High-Value Traffic
- Become a Google Analytics Power User — Part 3: Improving Site Engagement
Get more power over your digital marketing.
Nearly every marketer these days is familiar with Google Analytics, but not every interested party has a solid working knowledge of what GA is and what it can do for you. In this 3-part series, we’re going to explore some techniques to help take your knowledge of the Google Analytics platform to the next level.
This series will help show you actionable ways to generate more qualified leads, increase user engagement and, most importantly, drive more conversions. And, for director and manager-level folks, to gain a solid understanding of what your digital team members are seeing, judge the value they bring to your programs, and the relevant questions you should be asking.
I’ll be discussing three key concepts while providing you with actionable takeaways that you can apply to your own business and datasets.
The three concepts I’ll be covering in this 3-part series are:
- Understanding Users — how consumers interact with your marketing
- High-value Traffic — not everyone who views a page, or clicks, is the same
- Improving Site Engagement — to pull users (consumers) through your sales funnel
Although it may seem like a rather basic concept, understanding users is quite complex! There’s no one-size-fits-all to figuring out why users do what they do on any given site. No two users are the same, but when you start slicing and dicing data into subsets, you will begin to see similar attributes (traits, behaviors, patterns, etc.). Segmentation is perhaps the most valuable way to understand user behavior on any website.
Understanding Audience Segments: your foundation for success
Let’s begin with two very important consumer audience segments: “Converters” and “Non-Converters.” Understanding who is and who isn’t taking your desired action(s) is arguably the foundation to any successful business. Comparing these two segments can help you identify who your target audience is (and isn’t), why they convert (or don’t), and how you can better influence those that don’t convert.
Assuming you are tracking goals, events, and/or purchases, you’ll find these two audiences within the “segment” dropdown box located on every GA dashboard, just below the name of the report you’re viewing (look for the default “All Users” and click on it to view segments).
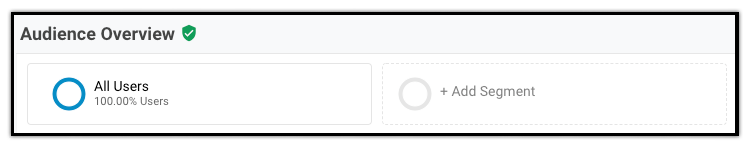
Deselect “All Users,” then select “Converters” and “Non-Converters.” Apply the segment and compare the difference between the two datasets. You’ll likely see that the Converters audience is much more engaged with the site, typically having higher pages per session, longer session durations, and lower bounce rates. You may also see Non-Converters having a lower percentage of return users and a low number of sessions per user. This may indicate these users tended to visit just once, compared to Converters who likely take multiple sessions before taking an action.
Depending on the purpose of any given page, a low session duration can indicate users are not engaged. But why? Is it the page’s content? Are you targeting the wrong audience? Setting the wrong expectations?
You may find answers with further segmentation. Try applying Converters vs. Non-Converters to language and location (under Geo), age and gender (under Demographics), device (under Mobile), browser & OS (under Technology), and affinity and in-market (under Interests). Look for red flags (and green ones!) in each.
- Are you getting a high percentage of non-converters from locations you don’t serve?
- Maybe your demo report is showing certain age groups or age/gender combos that convert more or less than others.
- Perhaps desktop is converting 3x better than mobile which might suggest you need to improve your mobile experience.
- Affinity and in-market data can show you categories of users who have a higher propensity to convert.
You can use insights like these to improve targeting, landing page content, and the overall user experience.
Understanding Platform Usage: your key to optimum UX
Next, we’ll look at platform usage. If you understand the devices and technologies that users use to access your site, you’ll get a better sense of how you can improve your site to best support them to deliver the best User Experience: UX to the digitally savvy.
Start by opening up the Mobile Overview report. Choose a conversion type (or all) and look at conversion rates. There’s typically a stark difference in conversion rates between devices. For example purposes, let’s assume the mobile conversion rate is much lower than desktop. By itself, this doesn’t tell us much, but if we drill down into mobile users, we might be able to shed some light on possible reasons why conversion rate is lower.
Filter out mobile users using the filter field, then add Operating System as a secondary dimension. Do you see a discrepancy in conversion rates between OS’s? Now drill down even further by changing the reporting view from “Data” to “Pivot table.” Pivot table allows you to view up to three dimensions at once. Choose “Browser” in the “Pivot by” drop-down and then select goal conversion rate, ecommerce conversion rate, or bounce rate as a secondary pivot metric.
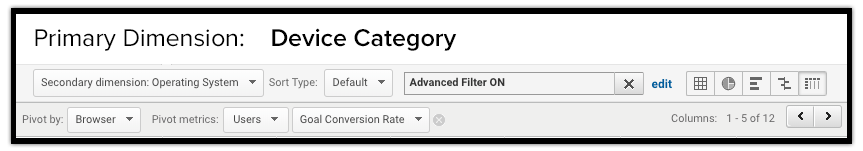
Do you see discrepancies in conversion rate or bounce rate by browser? Low conversion rates and/or high bounce rates could indicate that the mobile experience on a particular browser may need to be optimized. With this information, your next step should be to go through the conversion process on each underperforming browser, making note of any design or usability issues you come across. Don’t forget to segment out other technology dimensions like Screen Resolution, Browser Size, Browser Version, Mobile Device Info, etc. to perform even greater analysis.
Finally, custom reports give you greater flexibility.
My final piece of advice for segmentation is to become familiar with utilizing custom reports. Custom reports allow greater flexibility when combining dimensions and metrics than standard reports, plus you can save them so you can easily refer back to the data at any time.
Subscribe to the DMW Blog so you don’t miss out on part two of this 3-part series on becoming a Google Analytics power user. And if you’re considering a digital marketing campaign, DMW is always ready to help you strategize, plan, execute, and optimize. Call or email us today.