Digging Into Consumer Profiles Reveals A Winning Direct Response Insight
Kevin Courtright Boomer Marketing, Direct Mail, Health Care Marketing, Marketing Analytics, Medicare Marketing, Response MarketingPredictive modeling reveals multi-touch campaigns in a restricted “hard deadline” enrollment period exhibit very different consumer responses than typical “limited time only” campaigns. If your predictive model does not consider this — your response is suffering.
Direct response program response deadlines: Soft vs. Hard.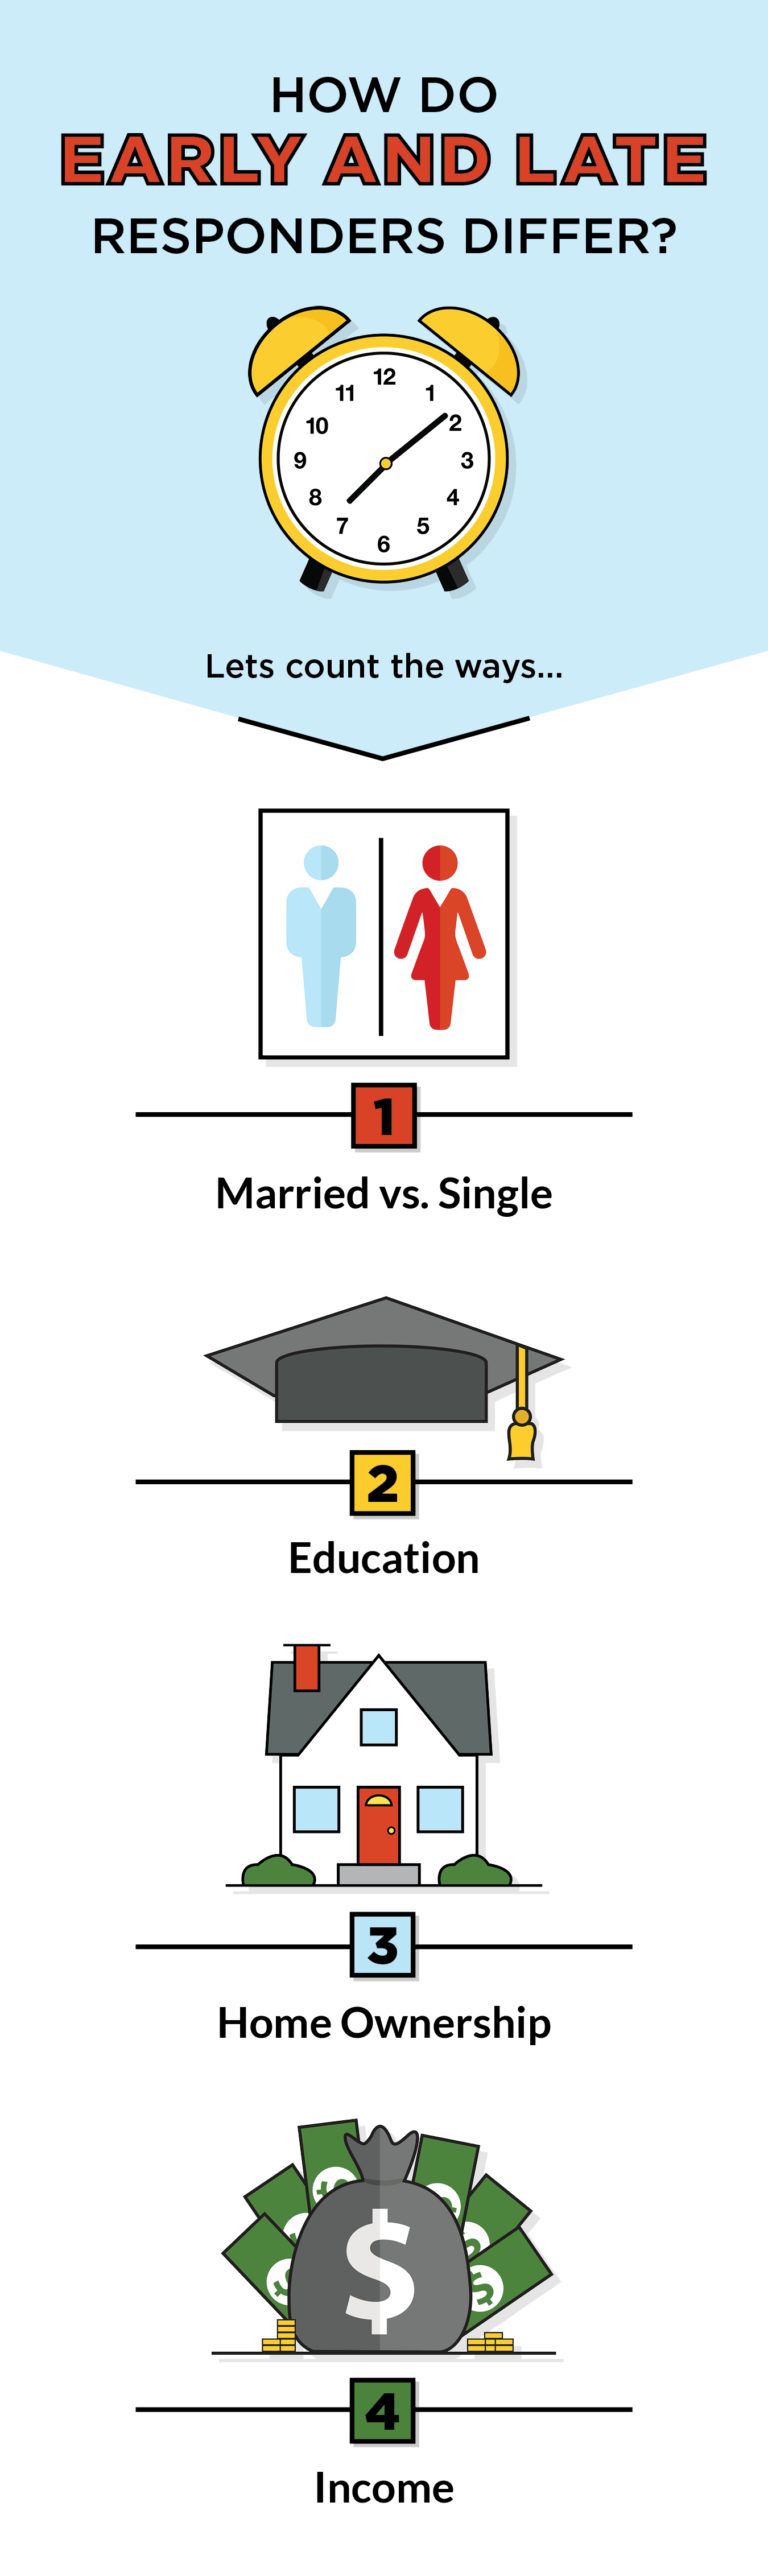
There are two different types of deadlines when it comes to making direct response marketing offers.
A “soft” deadline might provide a special discount for limited time. After that, the product is still available, but at the regular, not “sale” price, or lacking a promotional perk. You typically see examples of this in auto sales and department stores.
In contrast, “hard” deadlines mean that after a very specific period of time, the product itself is simply no longer available. A limited edition is one example. Another is the Annual and Open Enrollment Periods (AEP/OEP) for various types of health benefits and Medicare insurance.
Instinctively, due to the fundamental difference between the two types of deadlines, you might expect customers to react to each differently. But, as they say, “you know what happens when you assume.”
In direct marketing, assumptions are dangerous. Fortunately, we have data.
The big challenge in this instance is how to empirically measure the effect of hard vs. soft deadlines as well as how consumer response varies over the course of an Enrollment Period. By their temporary nature, testing, measuring, and developing reliable conclusions about a hard deadline can be nearly impossible.
At DMW, our health insurance clientele offers a unique opportunity to overcome this hurdle. We have been working with insurance plans across the country for decades. Monitoring, comparing, and contrasting multiple programs over time has led us to some interesting, and applicable, analysis for marketers across all categories.
The differences in consumer response we have revealed has had a major impact on our approach to response modeling. Researching this difference provided the focus of a study we recently conducted of response patterns we’ve seen for multiple clients over time.
Investigating consumer behaviors over the course of multi-touch direct marketing campaigns.
As a direct response/direct marketing partner for our clients, we are always on a mission to improve response and lower acquisition costs. As we combed through our clients’ response data from multi-touch direct mail campaigns and delved deep into the predictive models we built, we sought an answer to the following question:
“While consumers respond and enroll throughout a “hard” enrollment period, are there trends, idiosyncrasies, peculiarities, and/or characteristics that are unique to our audience and the time-constrained enrollment period?”
The findings: “There definitely differences … and they can undermine the power of your predictive model!”
Across multiple client campaigns, we found that their models’ performance were waning in the later direct mail touches. To be clear, we are not talking about a decrease in response across touches. That will obviously occur due to diminishing returns. Rather, we were seeing a decline in the predictive power of the model.
Upon closer inspection, we uncovered that some independent variables in the model were losing significance and — in some extreme cases — completely changing sign from a strong positive correlation to a strong negative correlation. Take for one example, household income:
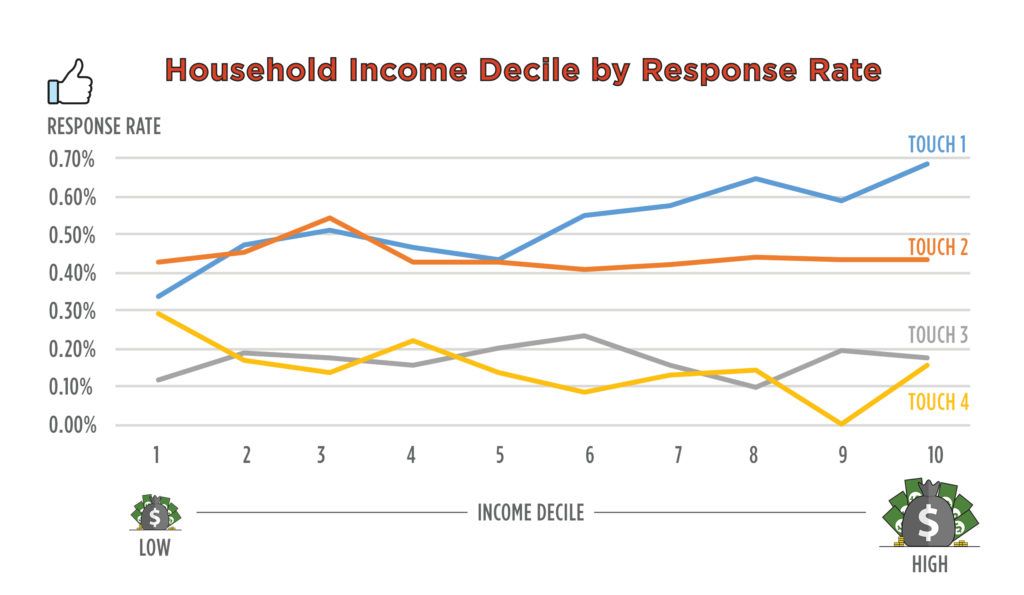
The chart above shows the performance of four consecutive direct mail campaigns from the 2015 AEP. (Results were similar across all time periods sampled.) The results are broken out into 10 income buckets with 1 = low income and 10 = high income. In the first touch, we see that response rate increases with income. For touches 2 and 3, the relationship becomes flat, indicating that there is no real correlation between response and income. Finally, in the last touch, response decreases as income increases.
As we discovered more variables that pivoted across touches, we were able to develop a picture of what late and early responders look like.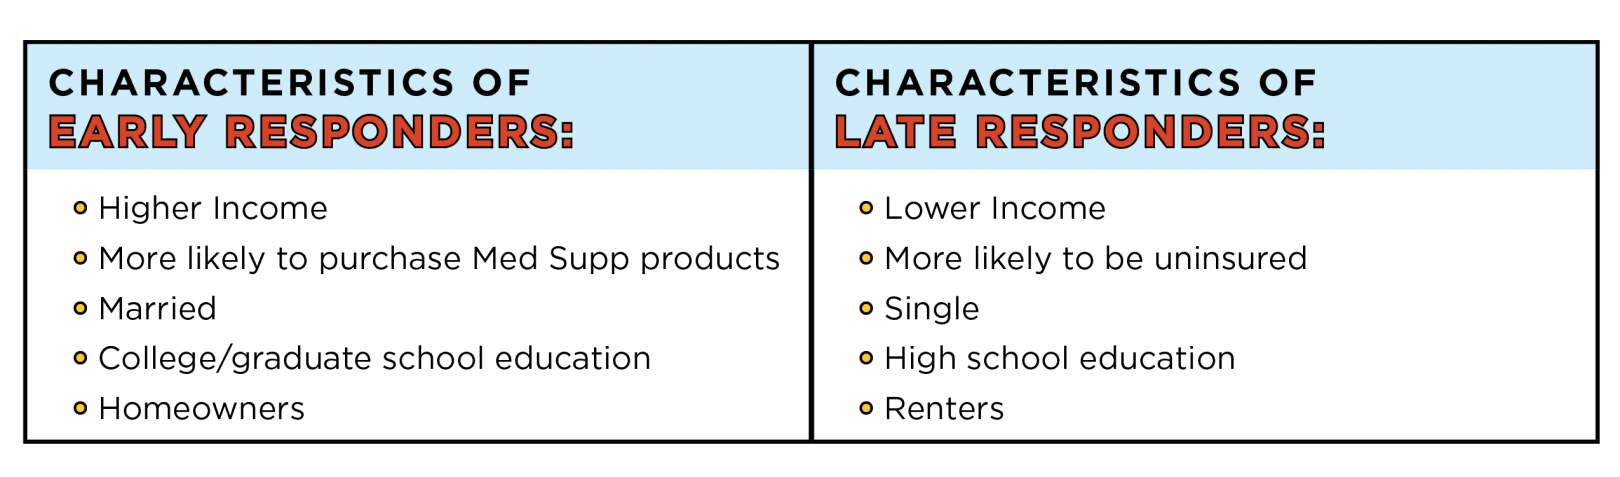
Beyond simply describing high- and low-income populations, these variables also spoke to long-term planning. Late responders were procrastinators in most other aspects as well!
We found this phenomenon to be persistent across clients, which completely changed our approach to response modeling for the 2016 AEP. Instead of developing a single model, we have developed a method to cost-effectively construct individual models for each touch.
 A fresh look at your consumer profiles can boost your direct response success
The shifting responder profile has further-reaching implications than just response modeling alone. Knowing when a certain type of customer is shopping will impact creative development, what products to offer, and the language used to speak to prospects. This understanding of consumer behavior has increased efficiency and optimization of our AEP campaigns to whole new level.
While the example above was specific to healthcare, this concept can be applied to any industry with “hard” deadlines. If there is a timeframe in which you could label individuals as early and late responders, your predictive modeling could be improved by allowing for their shifting profile.
We are adept at creating effective predictive models and applying them to campaigns. Learn more about our approach and how we might be able to help your next campaign.